
Small Caps could pullback as long-term 10-year Treasury yield resumes its climb
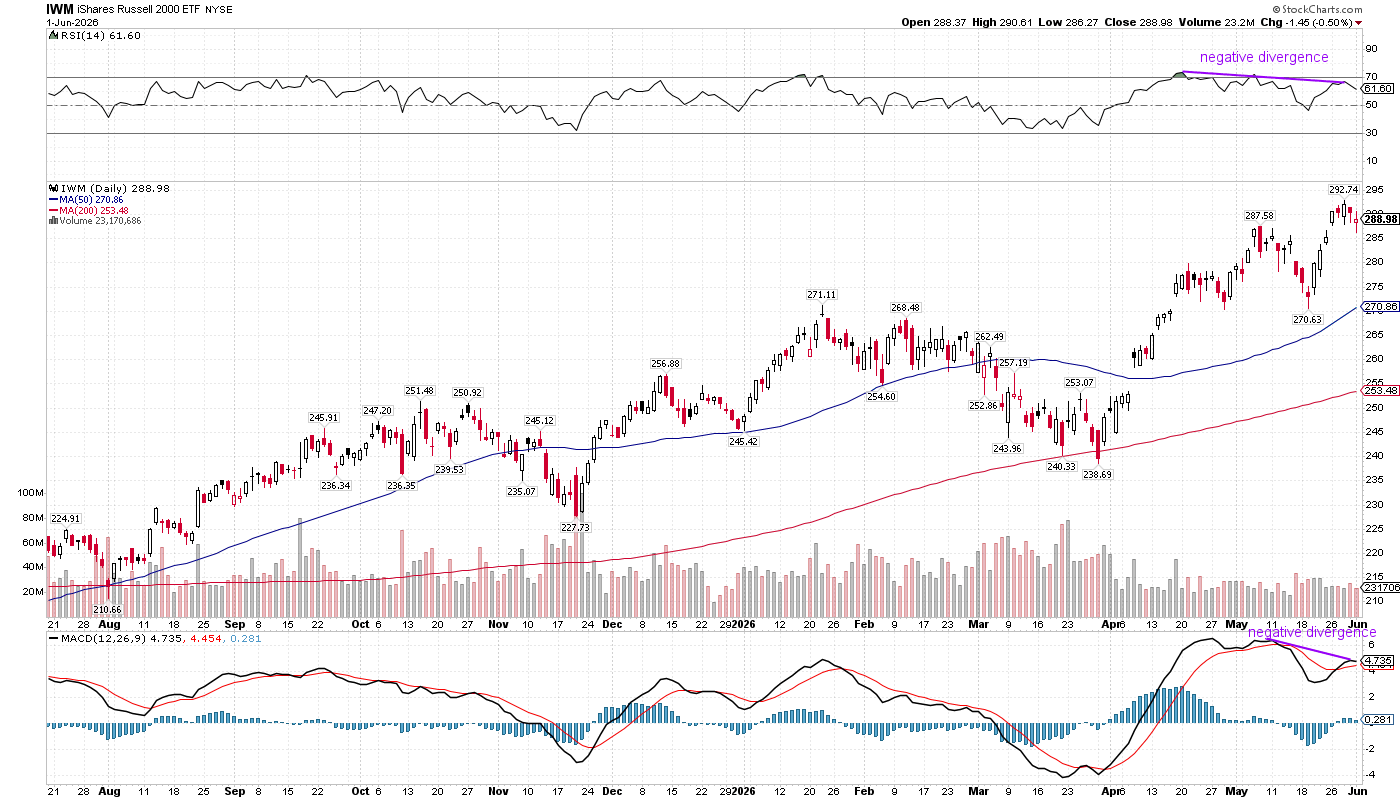
$IWM shows negative divergence on its daily chart with lower highs in RSI and MACD

Market is anticipating regime change from Kevin Warsh, the new FOMC Chair and the elevated oil prices creeping into climbing CPI and PPI is raising concerns about higher Fed funds rate to help curb inflationary pressure. Warsh wants to abolish dot plots, curb over communication from Fed members and also wants the FOMC to use trimmed averages of PCE, taking out rapidly rising components like gasoline, airfare and jewelry in April and falling prices for poultry, household linens and haircuts. During the pandemic, this trimmed average from Dallas Fed had drastically understimated the real impact of high inflation, as shown on the chart below.

Daily chart of 10-year Treasury yield $TNX shows an inverse head and shoulder breakout in mid-May above neckline around 4.49%, that measures to a target near 5.02%. However, it quickly peaked above 4.68% and pulled back with an island cluster (gap on both sides of sequence of candles between 4.55% and 4.68%) in late May. It came close to testing the rising 50-day moving average near 4.39% and tried to rebound yesterday, though failed to close above 4.5% and left a tail and closed near 4.47%.
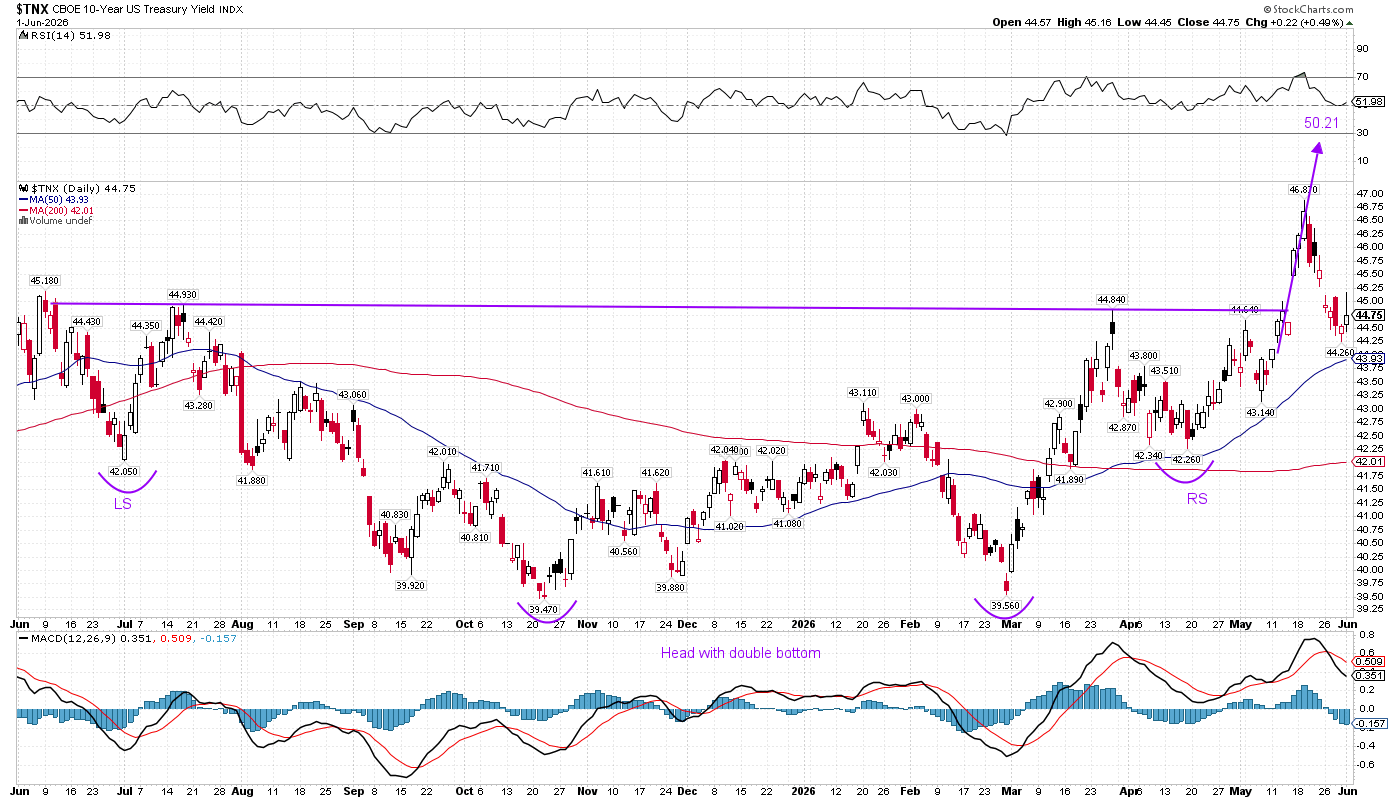
Rising yields can negatively impact Small Caps and in the days/weeks ahead, we have to closely monitor to see if 10-year yield resumes its climb towards October 2023 peak near 5%. Daily chart of Russell 2000 ETF IWM 0.00%↑ shows a potential pullback in the horizon, with negative divergence in RSI and MACD, indicating weakening momentum in the climb. A pullback to test its rising 50-day moving average near $270 is what we would be watching for.
A.C.