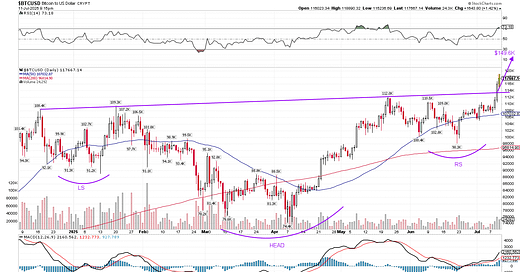
Let’s start with the huge breakout in Crypto leader Bitcoin this week! $BTC broke out of an inverse head and shoulder pattern with a neckline trending upwards and with a measured target near $150K. RSI and MACD are yet to climb to higher highs confirming the bullish momentum on the breakout, but the bullish trend is intact, with the 50-day moving average well above the 200-day moving average and with both of them climbing. Volume on the breakout wasn’t as high, which means smart money is not fully on the bandwagon yet and perhaps waiting on a broader market pullback to see how Bitcoin trades and then jump back in.
We know $BTC has been leading the broader market, peaking in January whereas $SPX peaked in February 2025. It also printed a higher high in May at $112K, a month ahead of $SPX printing that higher high above 6,147 on June 27th. Unlike $BTC, $SPX moved up the neckline resistance and seems to be setting up for a right shoulder pullback towards its rising 200-day moving average near 5,857, like $BTC did in June. Negative divergence in RSI (lower highs) indicates the possibility of a near-term topping pattern and a potential pullback next few weeks.
Nasdaq-100 ETF QQQ 0.00%↑ has a similar setup, crossing above the rising trendline, joining the series of higher highs from December 2024, but setting up for a pullback with triple negative divergence in RSI (three successive lower highs) and also weaker MACD with lower high from that in May.
A key indicator of market breadth weakening is the negative divergence in RSI and MACD of the cumulative NYSE Advance-Decline indicator. This also sets up the market for a pullback in the near-term.
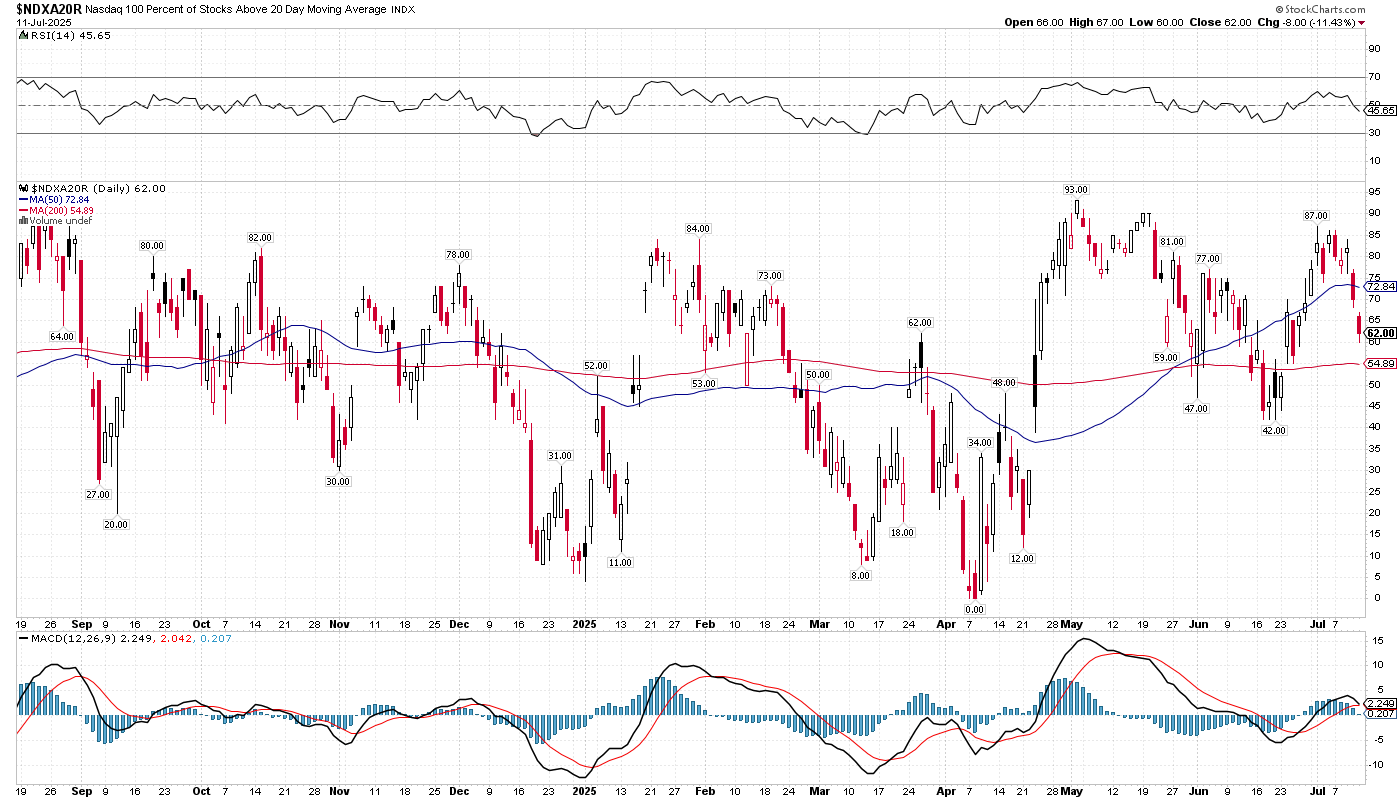
In terms of short term trend weakness in the Nasdaq-100 market, $NDXA20R daily chart, which shows the percent of stocks above their 20-day moving average has started its decline in earnest. It peaked at a lower high near 87 in early July (below the peak at 93 in mid-May) and has declined towards 60 last week!
Bullish percent index measured by the percent of stocks with bullish point and figure charts in the Nasdaq-100 index, $BPNDX, also peaked at a lower high at 80 (below 85 in mid May) and started declining last week.
Finally, one of the hottest sector in this V-shaped recovery is the Semiconductor Index, that gained 69% since April 7th low and is showing negative divergence in RSI (lower high), signaling a pullback ahead! The strongest stock in this space NVDA 0.00%↑ gained 94% from its April 7th low, shrugging off investor concerns about facing up to $15 billion revenue shortfall from export controls on their GPU sales in China.
In summary, market has come up a lot in a short period of time of three months and is gearing up for a pullback, following $BTC price pattern from June, and then breakout to much higher levels!
A.C.


