February 15th weekend chart patterns
Drawing out trends in Energy Select SPDR Fund $XLE and its top 8 holdings
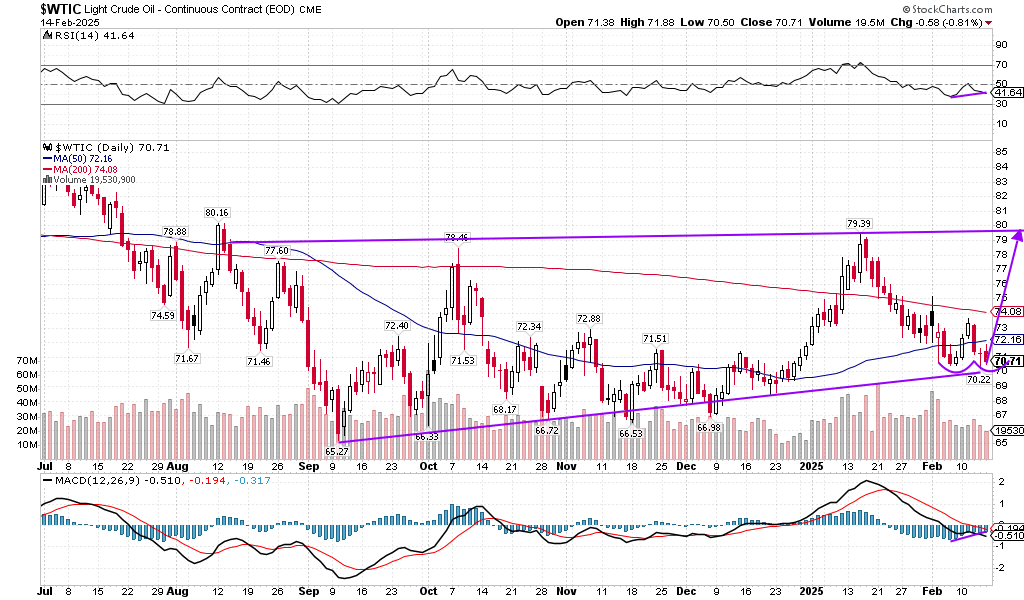
Crude oil price has come down from near $80 a barrel towards $70, over the past month. Rising inventories and hopes of a Russia-Ukraine ceasefire to be negotiated by President Trump brought prices lower. However, the daily chart of $WTIC shows a potential double bottom forming with higher lows in RSI and MACD histogram, indicating a possibility of a rebound back to the top of the ascending channel and key resistance level near $79-$80. Given the technical potential of a turning point ahead for crude oil price, let’s look at the daily charts of Energy SPDR ETF XLE 0.00%↑ and its top 8 holdings.
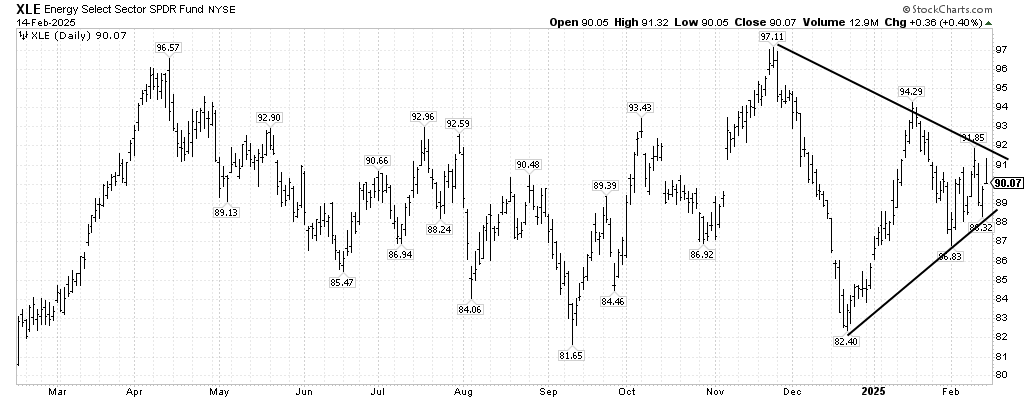
Daily chart of XLE 0.00%↑ shows a pennant forming, as price is converging towards an apex from the declining lower highs and ascending higher lows. If $WTIC chart rebounds higher, it would imply an upside breakout from the pennant shape for XLE 0.00%↑ and likely run to retest the November high near $97.
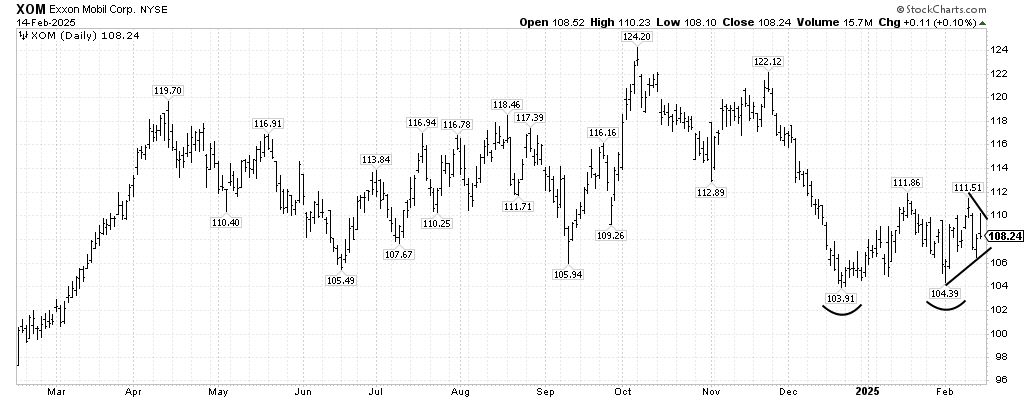
The largest holding in XLE 0.00%↑ is Exxon Mobil XOM 0.00%↑ with 22% weight. Daily chart shows a double bottom test near $104 and potential upside breakout from a near-term pennant forming in February. The measured target on the upside move could take XOM 0.00%↑ towards $119-$120.
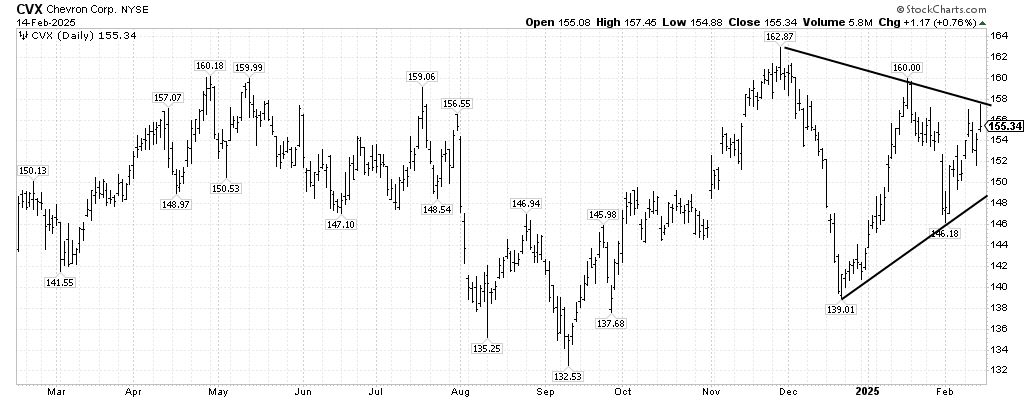
The second largest holding Chevron CVX 0.00%↑ with 16% weight also shows a pennant pattern, since its late November peak near $163. One could expect an upside breakout from this pennant pattern as well and potentially a higher high above $163 towards $180.
The third largest holding with 7.5% weight ConocoPhillips COP 0.00%↑ is trying to recover from its bottom near $93 around late December and seems poised for a reversal higher towards $117 from a pennant shape.
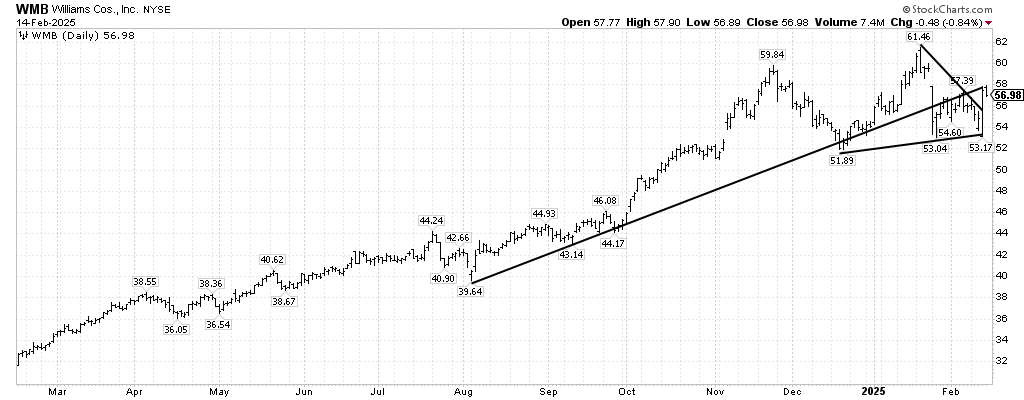
The fourth largest holding WMB 0.00%↑ broke down in January, from an ascending trend line joining the higher lows from August 2024. It then consolidated within a pennant pattern to break higher on Thursday after earnings. It pulled back after hitting resistance near $58, at the rising trend line joining the lows from August. It has the potential to break higher above $58 from a double bottom pattern near $53, to run to retest January high above $61!
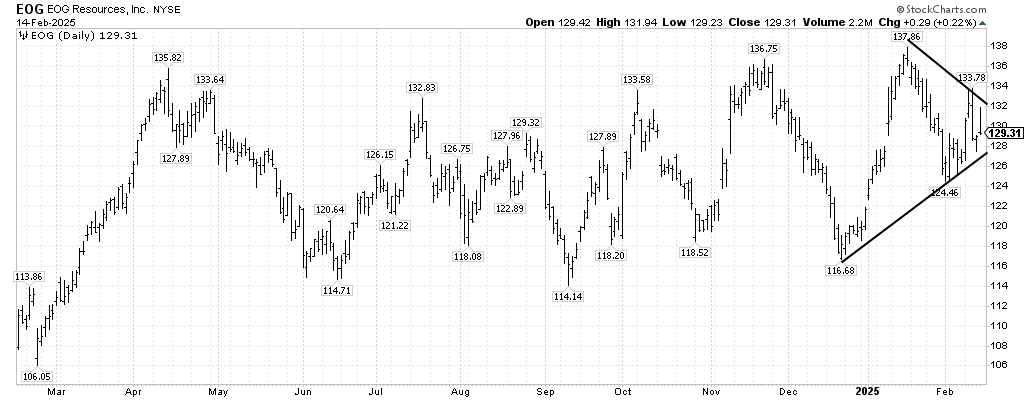
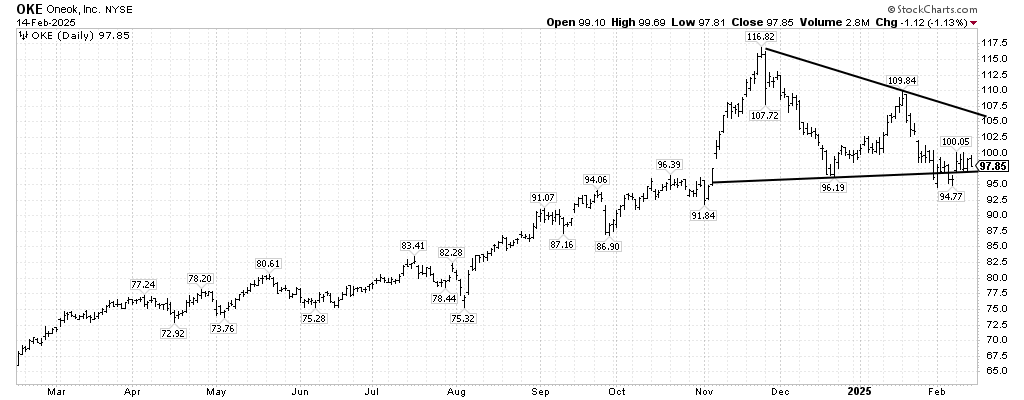
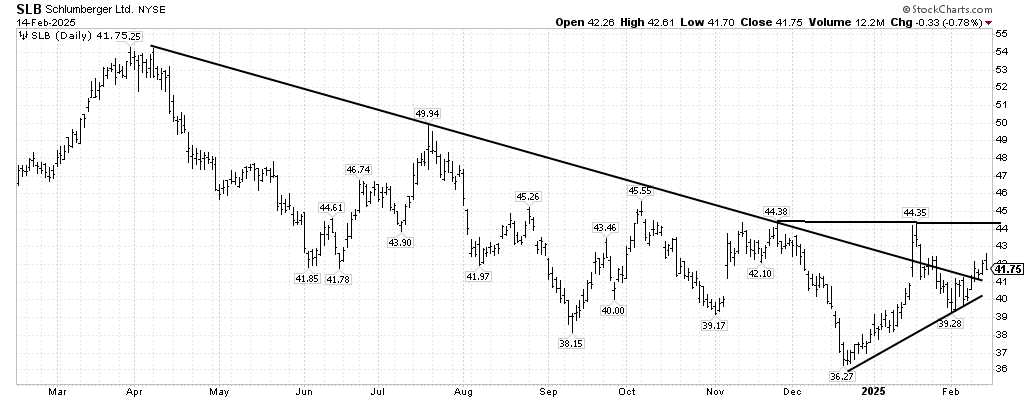
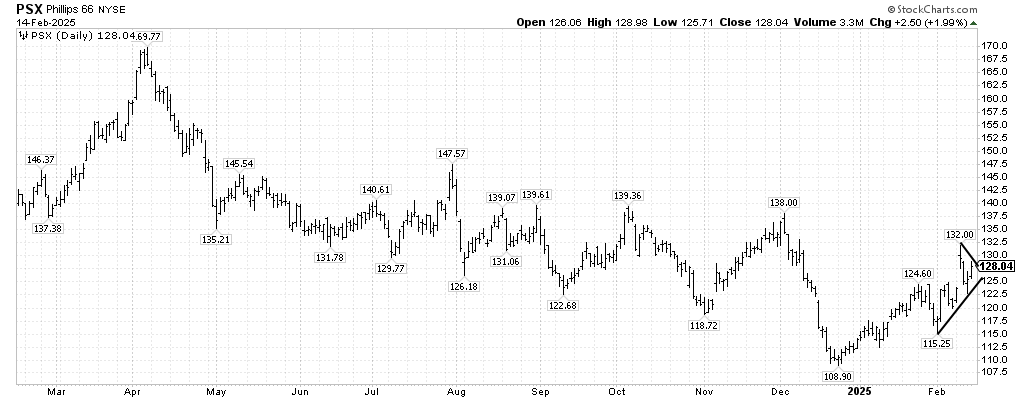
The next four holdings all have weights around 4% and have similar pennant shape reversal patterns! EOG 0.00%↑ has a potential to climb to $158 on the breakout. OKE 0.00%↑ has a potential bearish descending pattern and a break below $95 could take it to $75. On the other hand, SLB 0.00%↑ is likely forming a bullish ascending triangle pattern, where a break above $44 can take it towards $52. PSX 0.00%↑ also has an ascending triangle breakout above $124, that measures to a target near $140.
A.C.


